History
on Precious Metals
"Money is not wealth. It is merely a claim on wealth."
--Unknown
"During times of universal deceit, telling the truth becomes
a revolutionary act." --Unknown (misattributed to George Orwell)
"A government big enough to give you everything you need, is
a government big enough to take away everything that you have."
--Thomas Jefferson
"The trouble with Socialism is that eventually you run out
of other people's money" --Margaret Thatcher (a paraphrase).
Her actual statement was, "Socialist governments traditionally
do make a financial mess. They always run out of other people's money.
It's quite a characteristic of them. They then start to nationalise
everything, and people just do not like more and more nationalisation,
and they're now trying to control everything by other means. They're
progressively reducing the choise available to ordinary people."
(From an interview with journalist Llew Gardner for Thames Television's
This Week program on 5 February 1976.)
“Whenever destroyers appear among men, they start by destroying
money, for money is men's protection and the base of a moral existence.
Destroyers seize gold and leave to its owners a counterfeit pile of
paper. Paper is a mortgage on wealth that does not exist, backed by
a gun aimed at those who are expected to produce it. This kills all
objective standards and delivers men into the arbitrary setter of values.
Gold was an objective value, an equivalent of wealth produced. Paper
is a check drawn by legal looters upon an account which is not theirs:
Watch for the day when it bounces, marked “account overdrawn.”
--Ayn Rand.
History log
- <<John
Exter>>
- John
Exter (1910-2006): The Central Banker Who Made A Fortune In Gold.
Posted 1/23/2013. In a debate with Paul Samuelson in 1962, it dawned
on him how he could make a fortune in gold. "With a huge fortune
made on the gold market by using his own expertise on the foresight
of irresponsible central banking and its inevitable consequences,
Exter took an early retirement in 1972 and went into private consultancy
work."
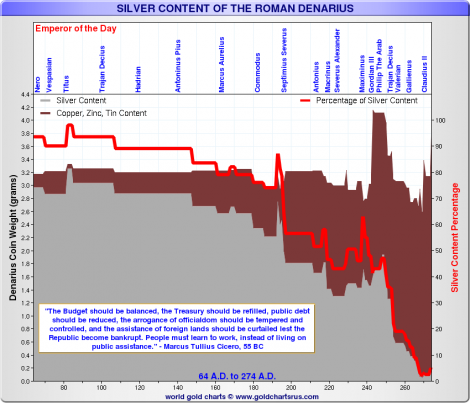
- A
Brief 2000-Year History Of Silver Prices. Posted 12/26/2012. It
is worth asking whether the price of silver stacks up as fair. For
more than 2,000 years, somewhere between 1/7th (4.2 grams) and 1/15th
(2.1 grams) of an ounce of silver would buy you a day’s labor;
in today’s terms, that would suggest that silver should trade
for $264, if U.S. wages should be seen as the global standard (i.e.
$58/day minimum wage). By way of comparison, minimum wages in China’s
Guangdong province (an area with extensive manufacturing activity)
would work out to about $6/day on average or about 5.6 g of silver
– about half the wages in 4th century Greece, so it really is
a case of what you consider to be the representative global wage.
If we take the Chinese wage, it takes about a week to accumulate 1
ounce of silver.
- (YouTube)
Extraordinary Popular Delusions And The Madness Of Markets. Posted
10/20/2012. Presentation of economic bubbles in history. Four phases:
(1) Stealth phase, (2) Awareness phase, (3) Mania phase, and (4) Blow-off
phase.
- Private
debt caused the current Great Depression, not public debt. Posted
5/11/2012. Private (corporate and consumer) debt in 1929 was 240%
of GDP versus 310% in 2008. [I NEED TO VERIFY THIS DEBT RATIO,
otherwise this author's whole argument falls apart.] (It has currently
dropped to 260% of GDP.) Government debt in 1929 was a paltry 40%
of GDP. (It is currently over 100% of GDP.) In 1945, when America
was financing its participation in World War II, government debt exploded
to 120% of GDP. It is interesting to note that there was also a Real
Estate bubble in the 1920s, from 1921 to 1926. See The
Forgotten Real Estate Boom of the 1920s. The author argues
that the debt that must be destroyed is, primarily, Private Debt--private
enterprise debt and private consumer debt. Private sector debt
destruction (or deleveraging) is likely to continue for a decade or
more, given the level of accumulated private debt.
- 8
Reasons Why The Great Depression Is The Best Case Scenario. Posted
9/21/2011. Back in the Great Depression years, Americans could feed
themselves with farming, had strong family and community support systems,
had a manufacturing (versus consumer/debt-based economy), were more
physically active and fit (versus obese and inactive).
History of the Federal Reserve (the Fed)
Historical charts
From: Why
The Debt Exploded. The chart below is an exponential growth curve
in U.S. government debt. Of course, the numbers on the national debt
are grossly understated as it doesn't account for the tens of trillions
of Dollars of unfunded and unpayable obligations tied to Social Security,
Medicare, and so forth. In other words, the debt situation is even worse
than this chart portrays.
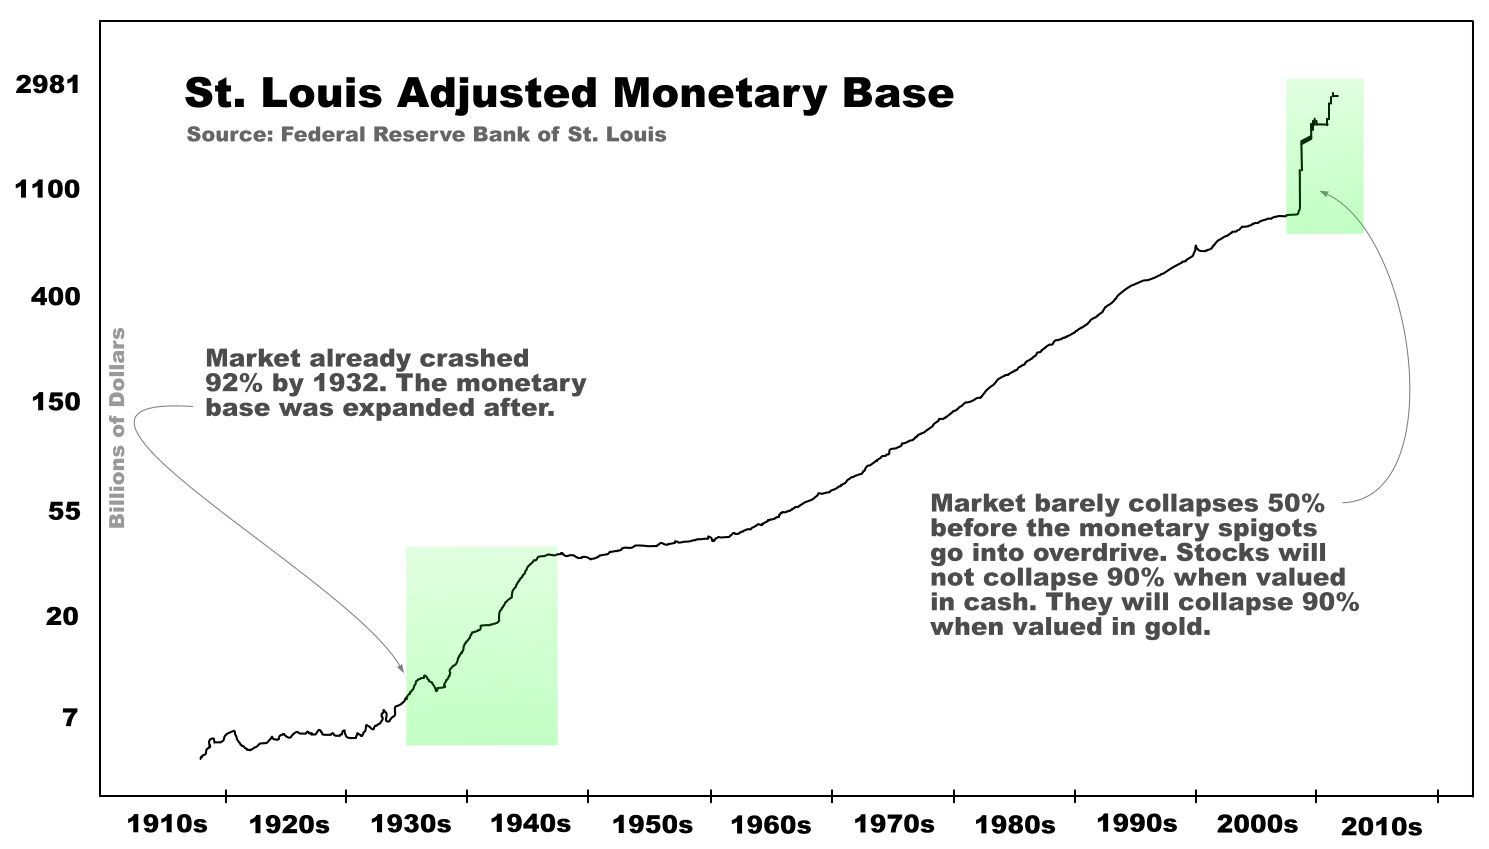
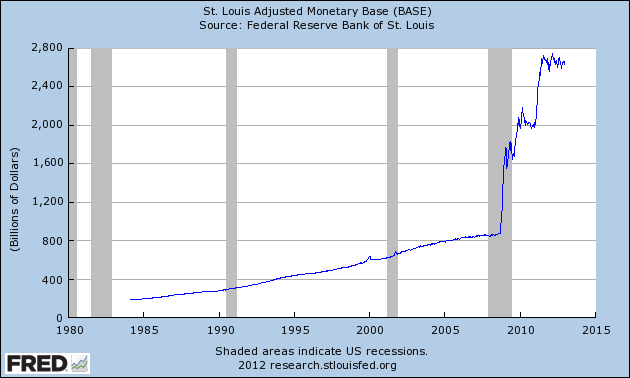
St. Louis Adjusted Monetary Base
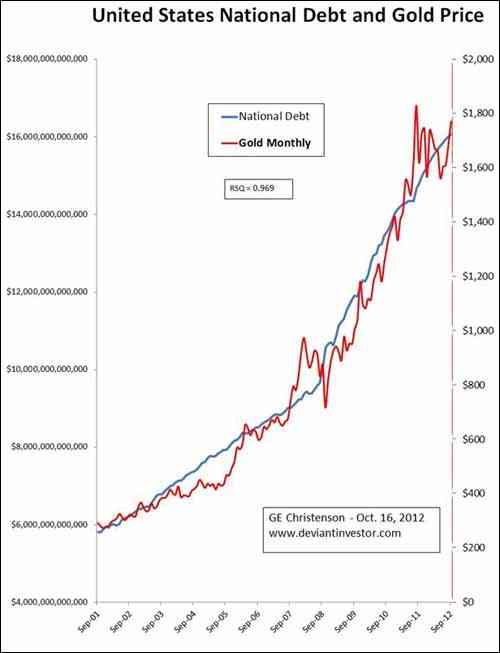
United
States National Debt and Gold Price. The exponential
growth rate for the national debt averaged over this period is 9.7%
compounded annually, while the rate averaged over the last five years
is 12.3%. The exponential growth rate for gold is a bit larger –
about 18% per year compounded annually. I attribute this to the realization
that gold is a competing currency, mining supply is growing little,
most governments are aggressively “printing money,” investors
are increasingly interested in gold, and central banks are buying, not
selling gold.
Analysis of Historical Charts
From: Gold
& The Frightening Picture Of Our Financial Abyss. Posted 1/3/2013.
The author ompares the Adjusted Monetary Base (from Federal Reserve
Bank of St. Louis) to the price of Gold since 1984. Shows the undervaluation
of gold relative to the monetary base. It is clear that gold is nowhere
near the overvaluation of the 1980s. All the following data is courtesy
of the St.
Louis FRB.
St. Louis Adjusted Monetary Base
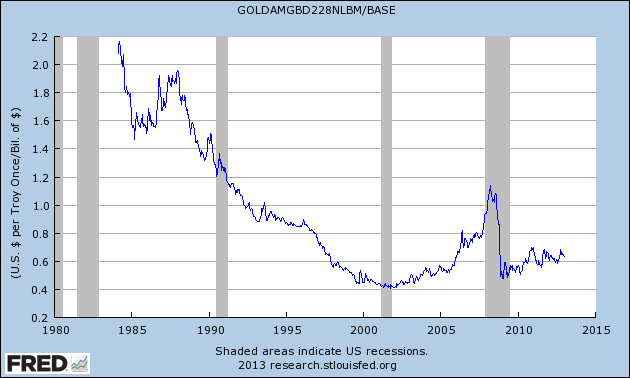
The price of Gold divided by the St. Louis Adjusted Monetary Base.
Notice how undervalued Gold is today relative to the 1980s. "Given
that there is no end in sight for increases in the monetary base, the
financial potential energy contained in the current price of gold is
extreme."
The following chart shows the nominal (not inflation-adjusted)
silver price in red, while the real (inflation-adjusted) silver price
is superimposed in blue. This uses the CPI to recast silver prices in
constant November 2012 dollars, the most recent monthly CPI data currently
available. Reference: Real
Silver Highs 4. Posted 1/11/2013.
How the silver content of a Roman denarius declined over time.